The generation mix varies by geographical location and season, and different fuels are used to generate electricity used by homes, factories, and businesses across the United States.
The fuel mix in most markets typically reflects a seasonal period throughout the year. These seasonal differences are ultimately dictated by basic, natural human instincts and our strong reaction to changes in temperature. Simply put, when it is cold, humans turn on the heat. When it is hot, humans turn on the air conditioning. In both cases of extreme temperature, we are consuming our maximum amounts of energy.
Winter and summer months, such as January through March and June through August, are referred to as peak months because they are typically prone to reaching record highs and lows. The months which tend to experience milder temperatures are often referred to as shoulder months.
April, for example, is considered a shoulder month. The graphs below all represent the fuel mix in three major energy markets in the US, ISO-NE, PJM, and ERCOT, and have been taken on an average temperature day in April.
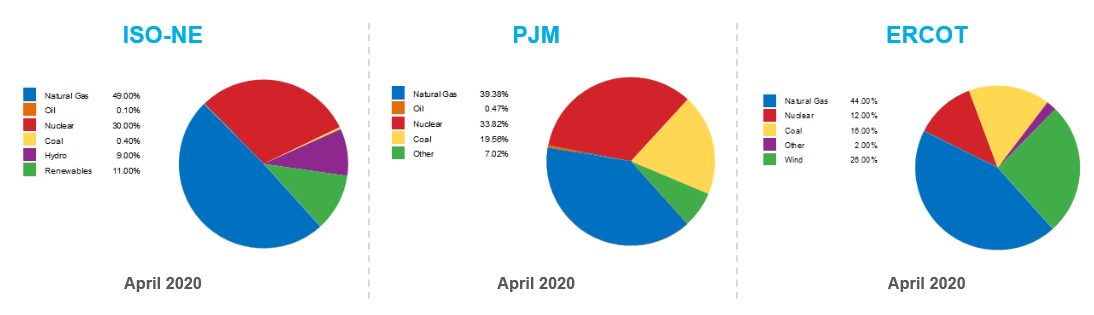
Natural gas plays the largest role in all markets on this average day. From there, the order of the electric generation fuel rank changes among regions. The second leading fuel source in ISO-NE and PJM is nuclear, while wind is the second leading in Texas.
Alternatively, the chart below represents the fuel mix in ISO-NE during three different periods. The fuel mixes are taken from an average day in a shoulder month (left), a winter day under extremely cold temperatures (middle), and a summer day experiencing extremely high temperatures (right).
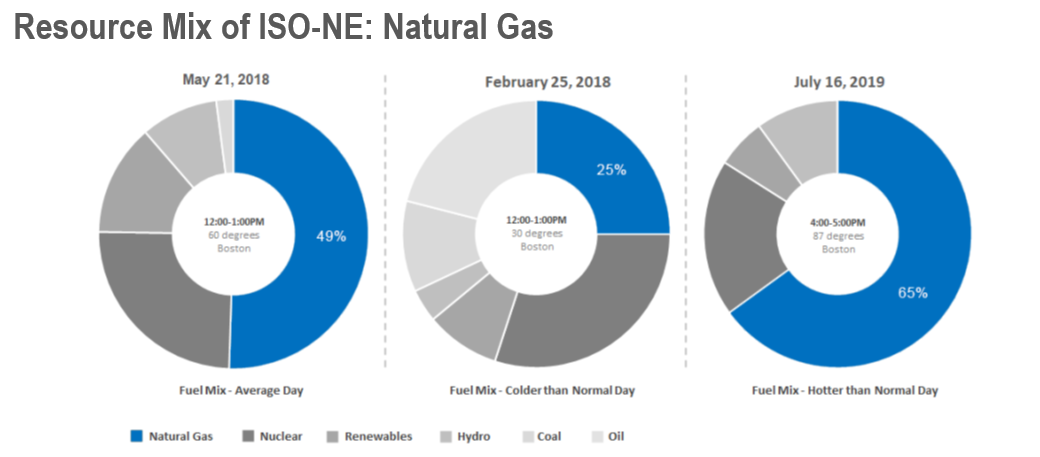
Like in the first example, the chart on the left illustrates the fuel mix for an average day in a shoulder month, showing natural gas leading the electric generation fuel mix.
Natural gas is also the leading generation source illustrated in the summer fuel mix chart; however, the chart shows a significant increase in energy demand, which is covered by natural gas fuel supply. This added demand for electricity increases the percentage share of natural gas from 49% of the fuel mix on an average day to 65% on a hot, summer day.
On the other hand, the graph representing the fuel mix in a winter month, during extreme temperatures, suggests that the percentage of natural gas decreased in the fuel mix. This decrease in natural gas consumption is due to a reduced demand for electricity.
In the example below, there are regional pie charts for natural gas consumption by an end-user in the three markets mentioned previously – ISO-NE, PJM, and ERCOT. Additionally, there is a pie chart representing Colorado’s natural gas consumption has also been included. All four charts show indicate that natural gas is being used for a large percentage of the electric generation in every region, which illustrates how important natural gas is to each one. Essentially, almost everything we do each day is powered predominately by electricity generated from natural gas.
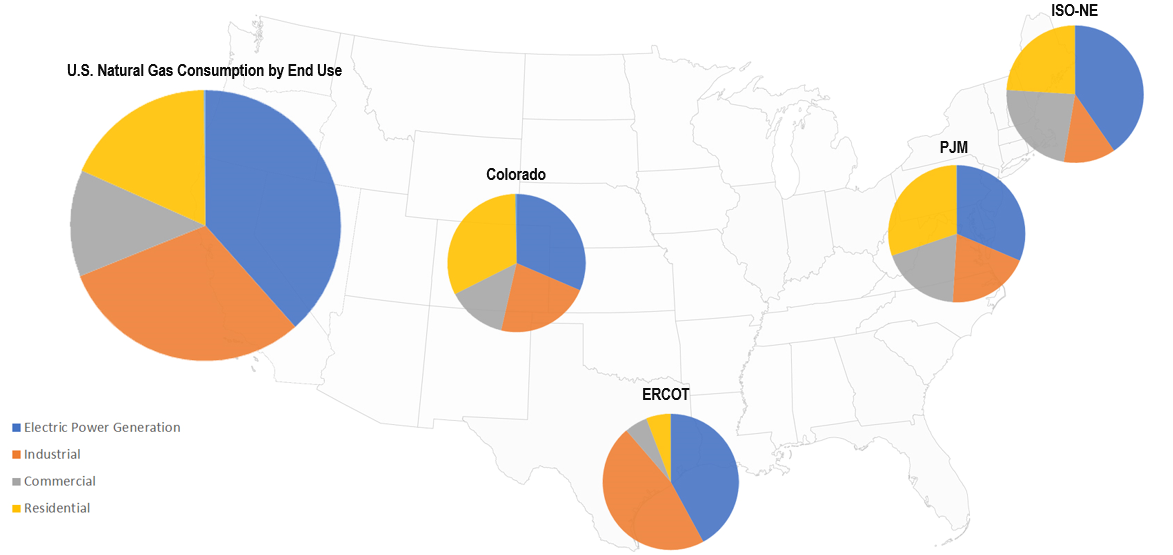
The obvious difference between these four regions has to do with their average temperature. For example, residential natural gas consumption in the southern region of Texas is a very small portion compared to residential consumption in all the northern regions, which is predominantly used for heating homes instead of being used to generate electricity.
Our government has declared heat is a necessity and has rules in place that guarantee residential citizens natural gas for their heating needs before businesses. Therefore, during times of extreme cold, the heating needs of consumers significantly increases demand for natural gas, which causes the supply to reach maximum capacity within pipelines.
When pipelines reach maximum capacity, other fuel sources must make up for the shortfall, which results in high prices and price spikes.
Understanding how and when your company consumes natural gas during the day and throughout the year allows you to optimize your natural gas purchasing strategy.
Over the years, the fuel mix has and will continue to evolve, so it is highly recommended that energy consumers stay informed about the market conditions. This information is beneficial to commercial and industrial businesses as well as industries that use a significant amount of energy.
Being aware of market conditions allows consumers to develop purchasing strategies that will meet their risk tolerance and plan optimal contract term lengths.

